Bodygraph rendering API
Render a complete Human Design bodygraph as SVG or PNG. The image carries activated gates, defined channels, defined centers, gate numbers, and the Design and Personality planet columns.
Every parameter on this page is a live control in the Visual Rendering studio: pick a palette, move the columns, change the arrow style, round the centers, and watch the chart update instantly on a sample chart before you spend a request.
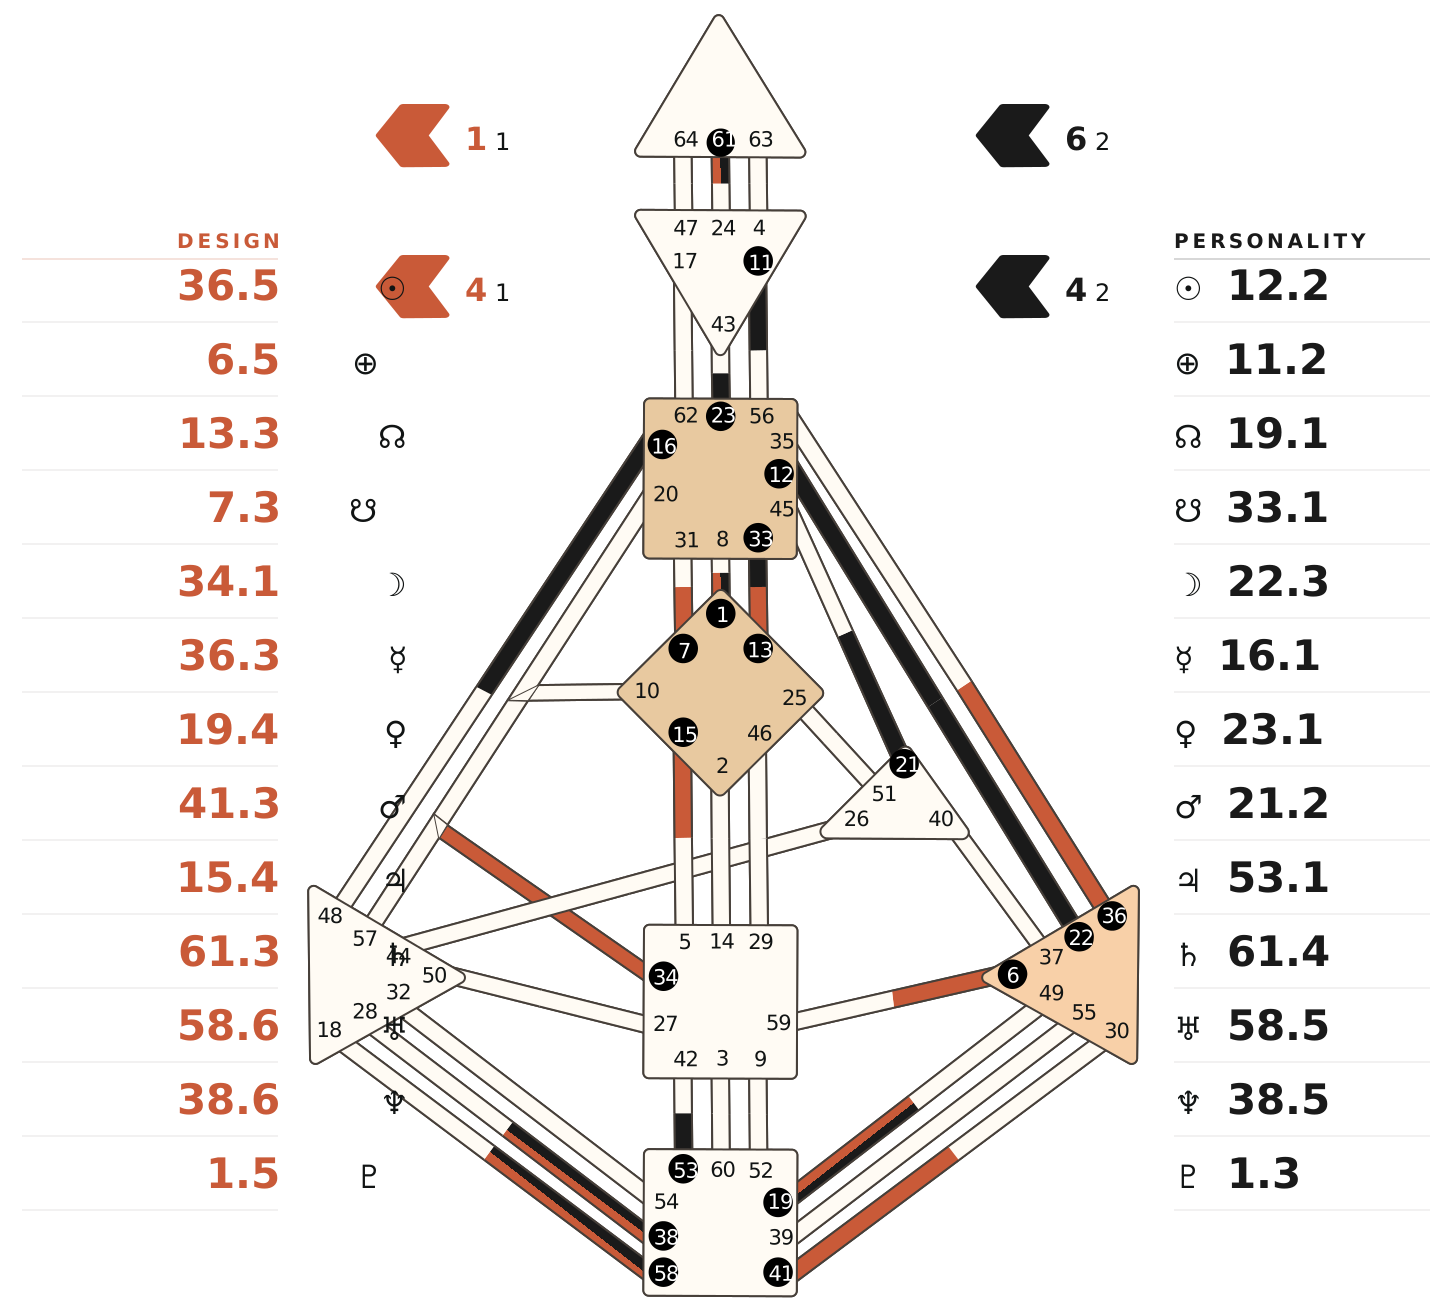
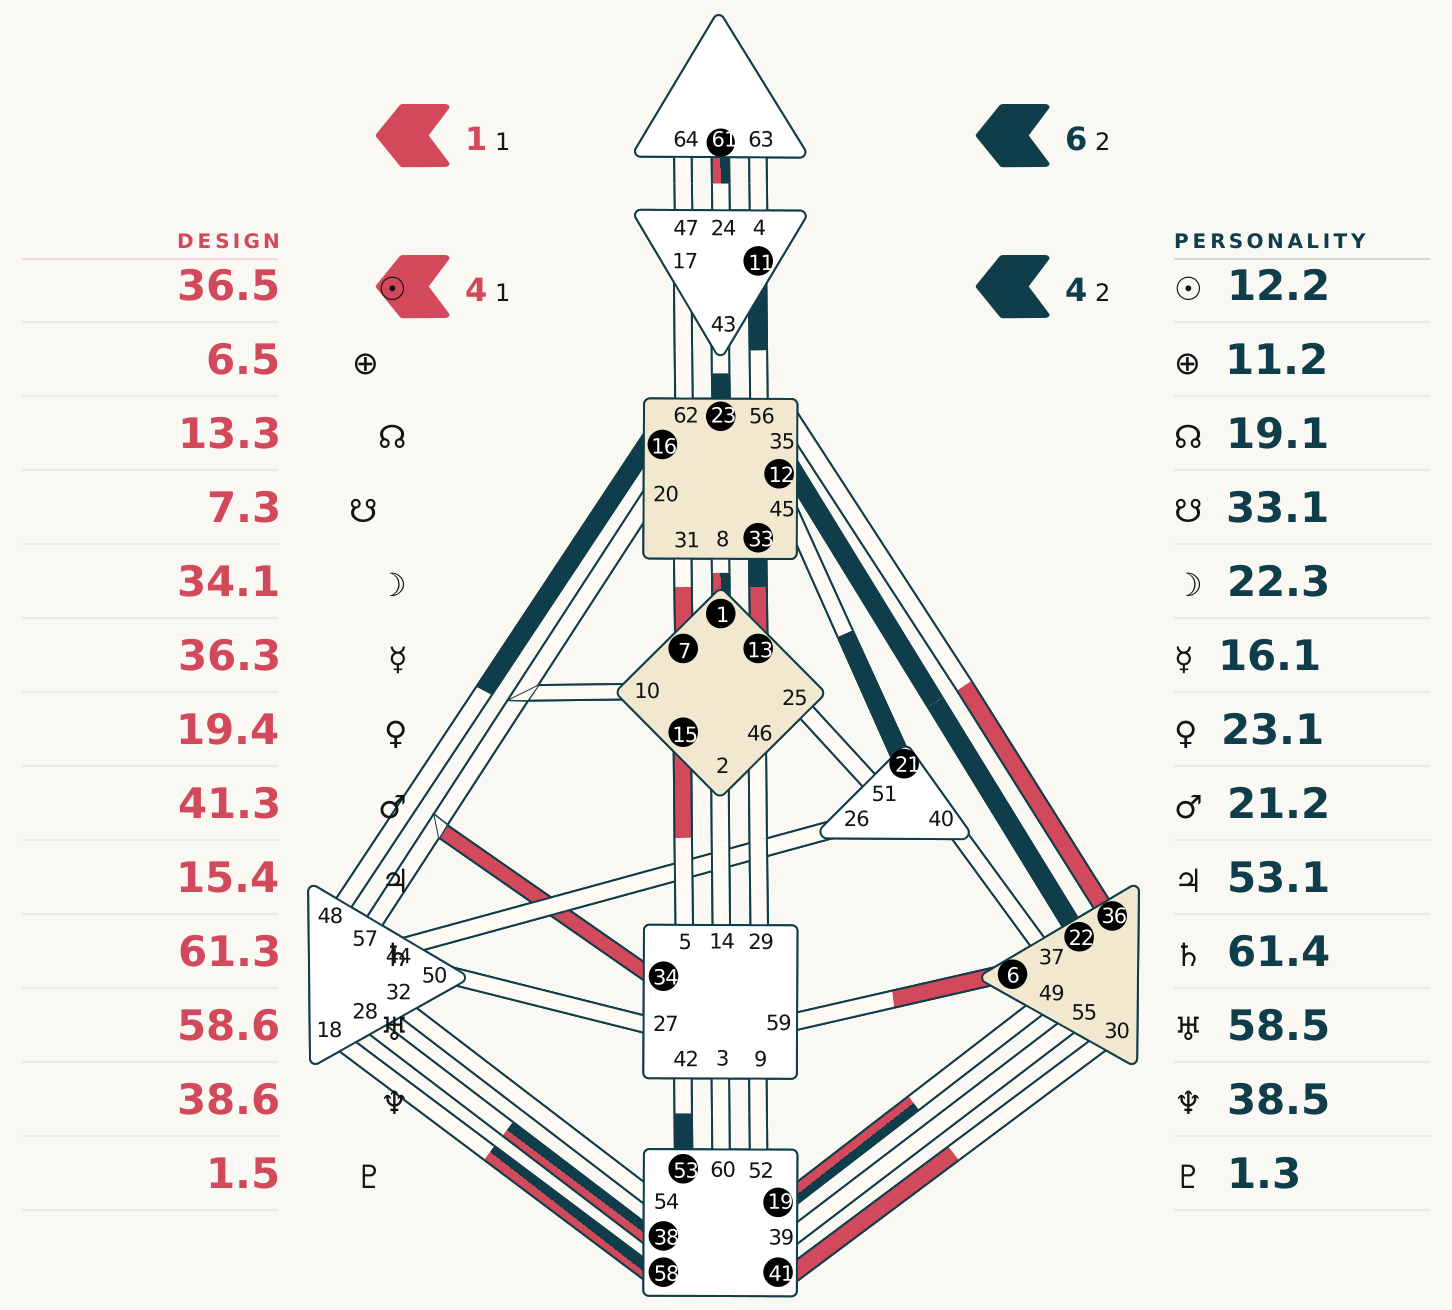
Request bodygraph.svg for markup you can style, or bodygraph.png for a finished image. Both take the same birth data and the same parameters.
The SVG includes stable ids and data-* attributes on every gate, center, and connector for CSS styling and interactivity. The PNG is rasterized at the requested width for environments that do not render SVG (chat apps, email, PDFs).
Request
Birth inputs match every Human Design endpoint. Query string on GET, JSON body on POST. When a parameter is sent both ways, the query string wins.
Customize the render
Every parameter below is optional and works on both formats, on the query string or in the JSON body. A parameter that fails validation returns a 400 whose param field names it.
Test parameters using the sample chart. It requires no key, bills nothing, and uses the exact renderer:
The playground puts every parameter behind a live control.
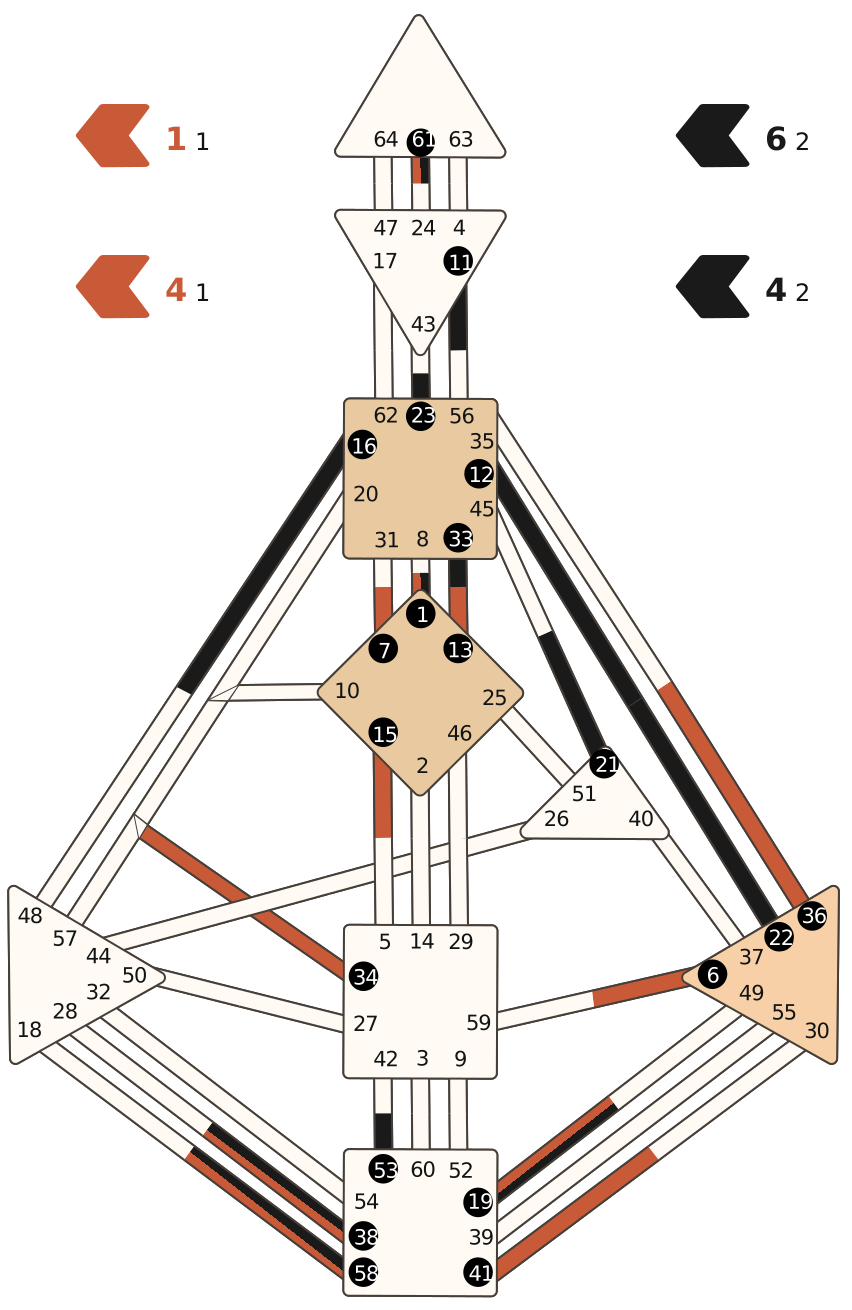
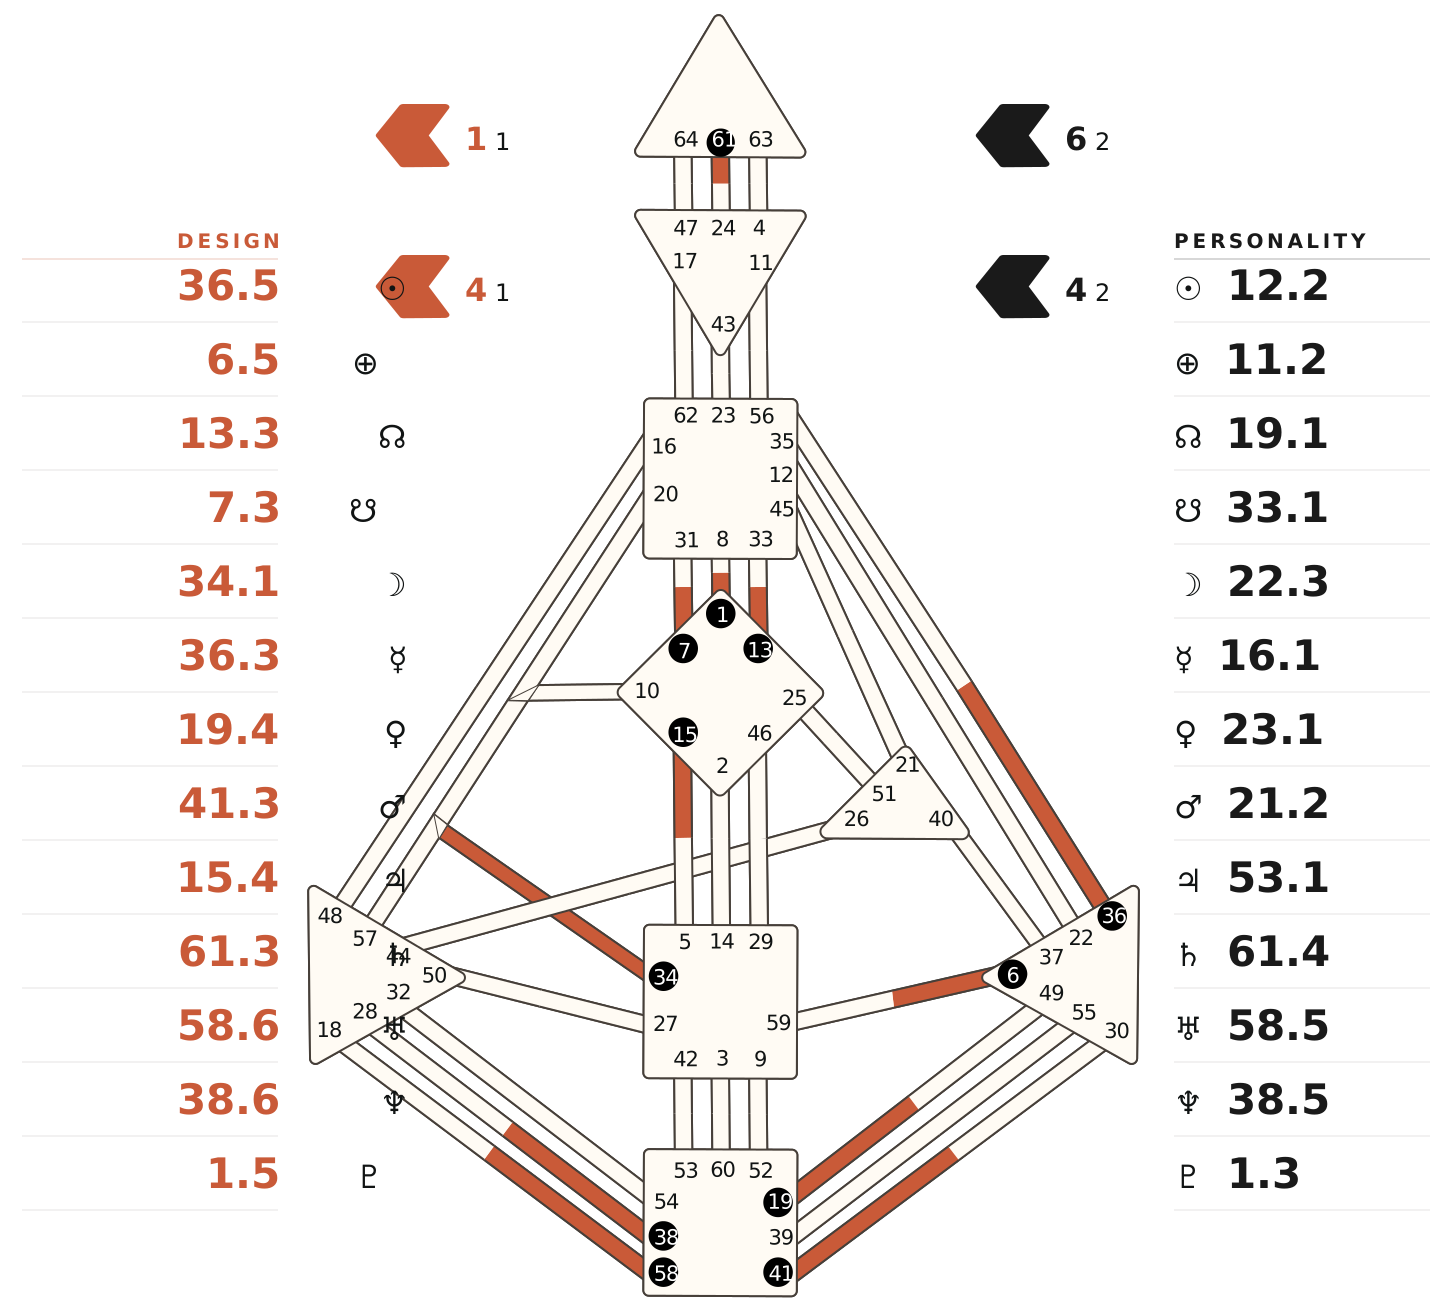
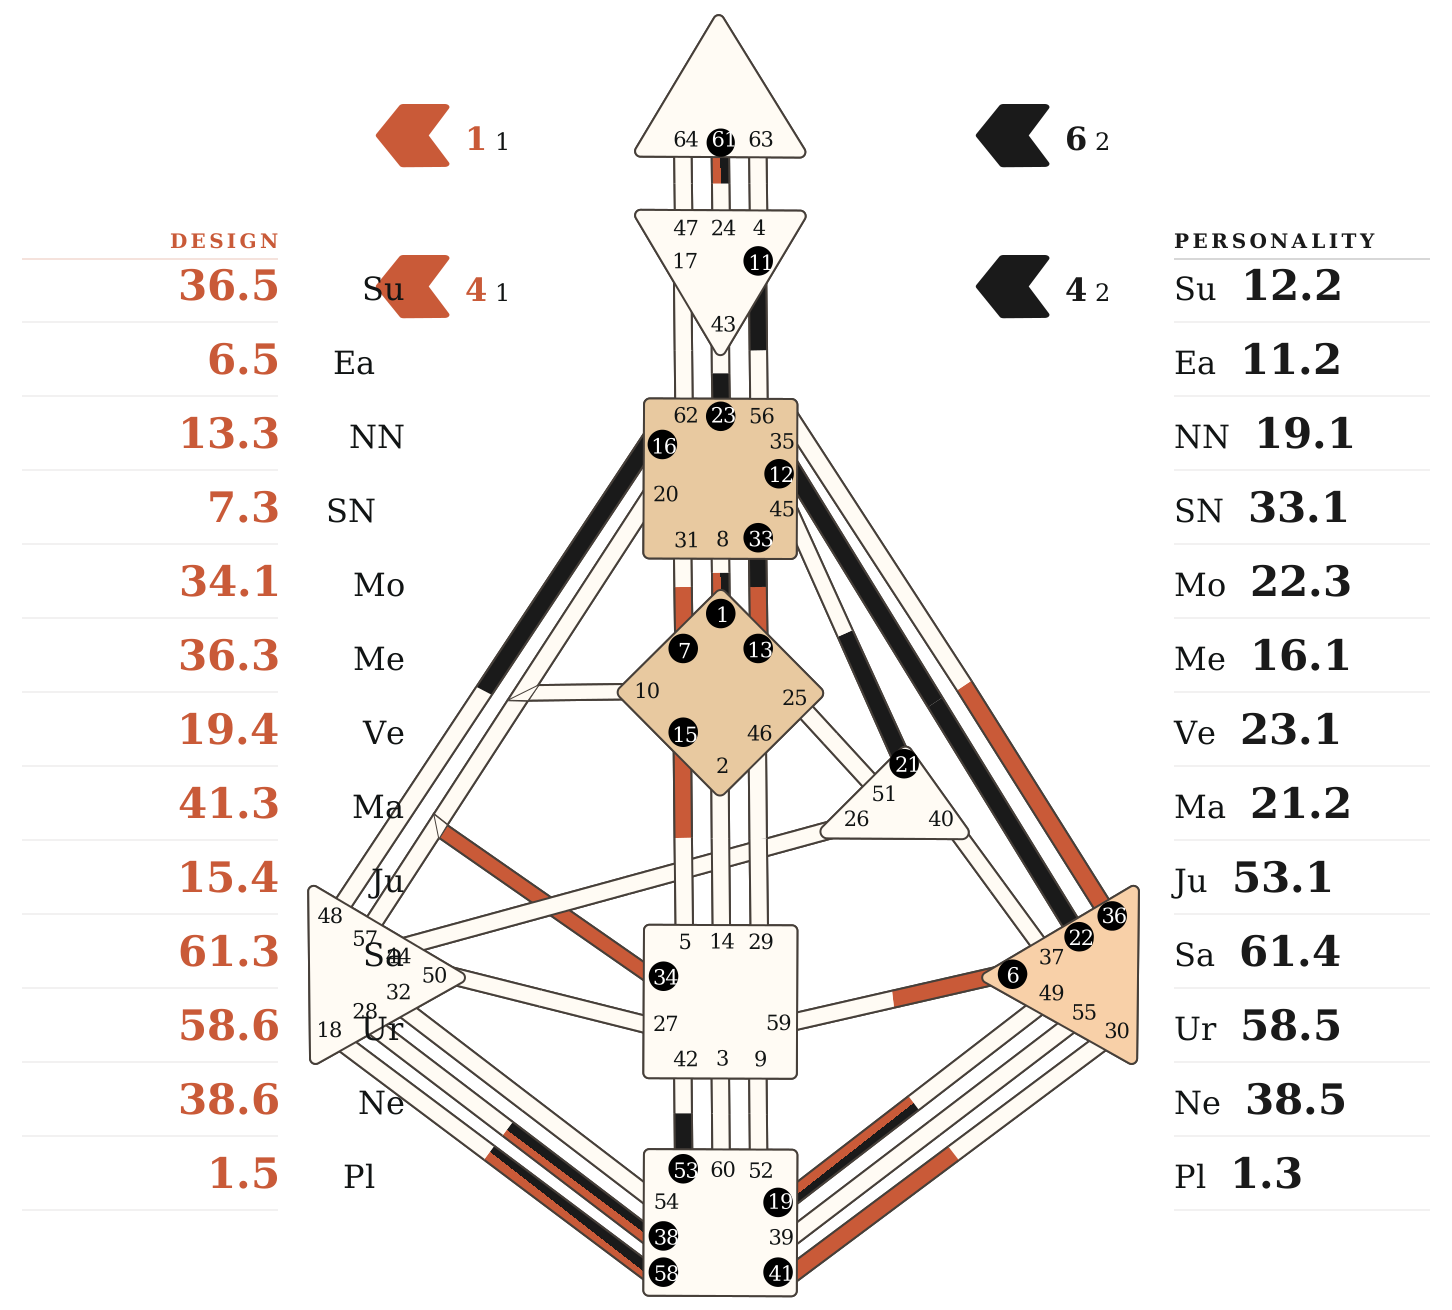
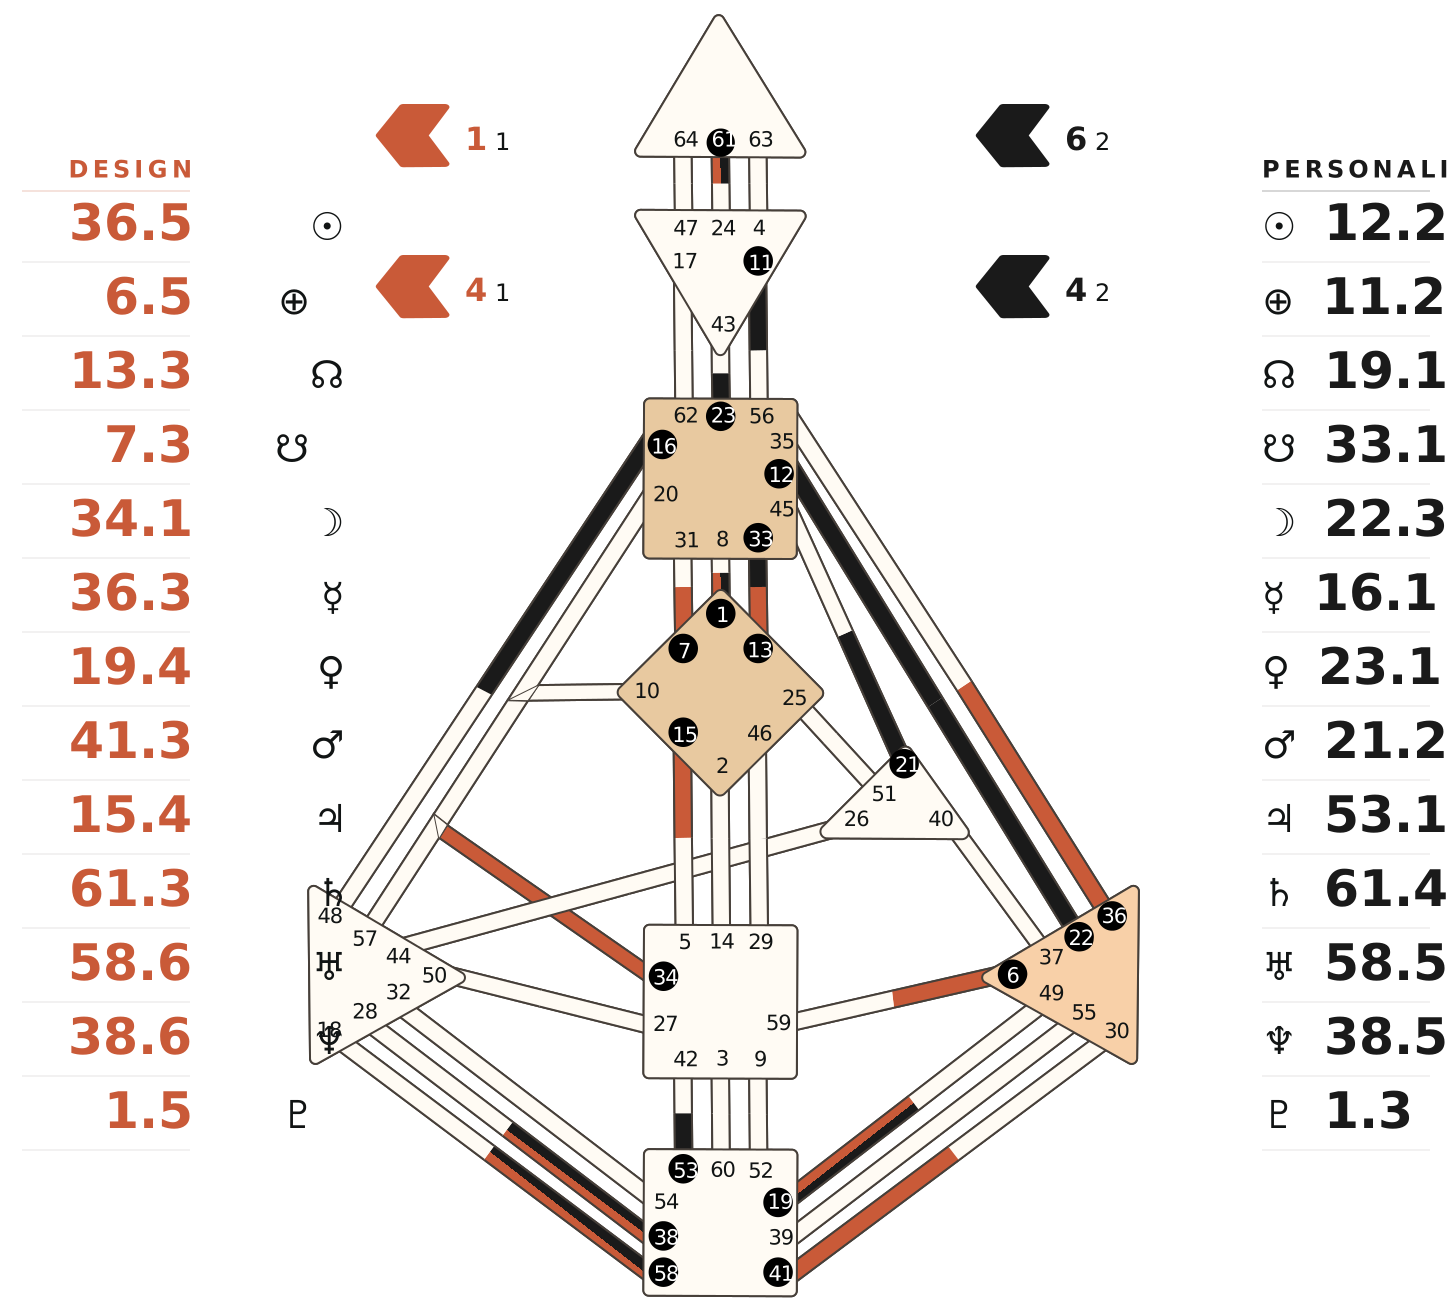
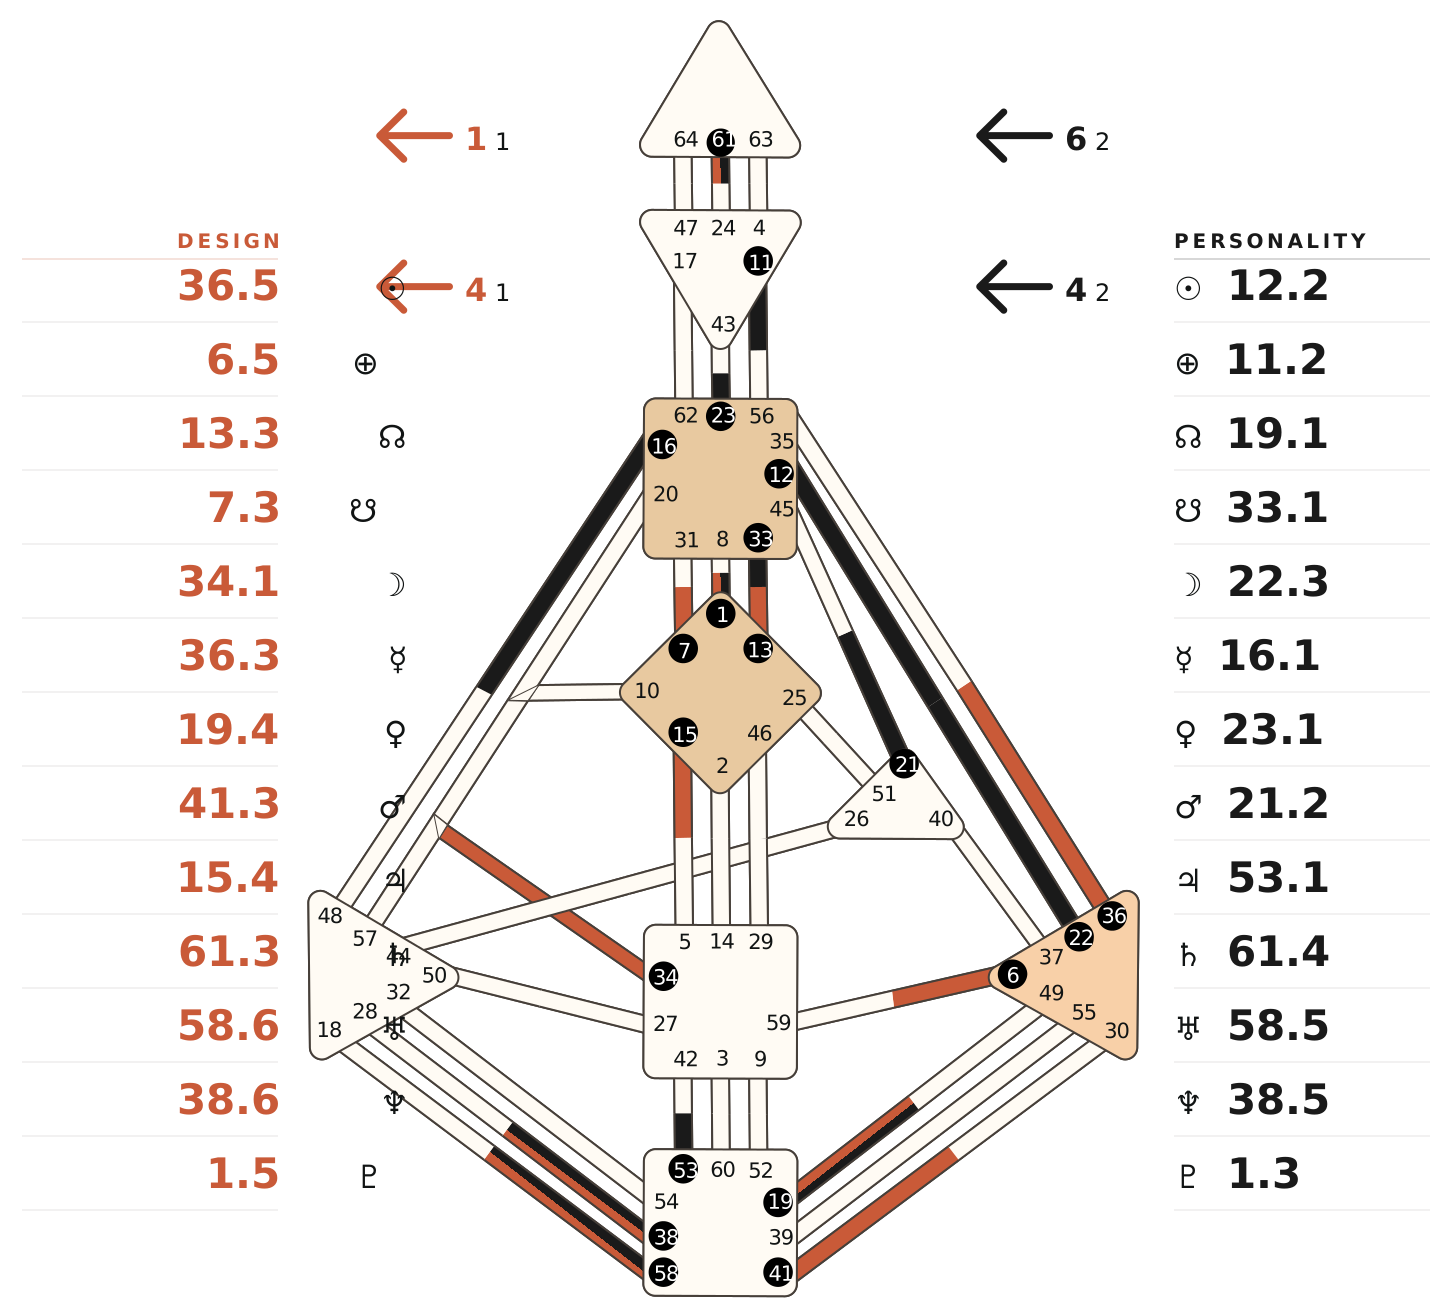
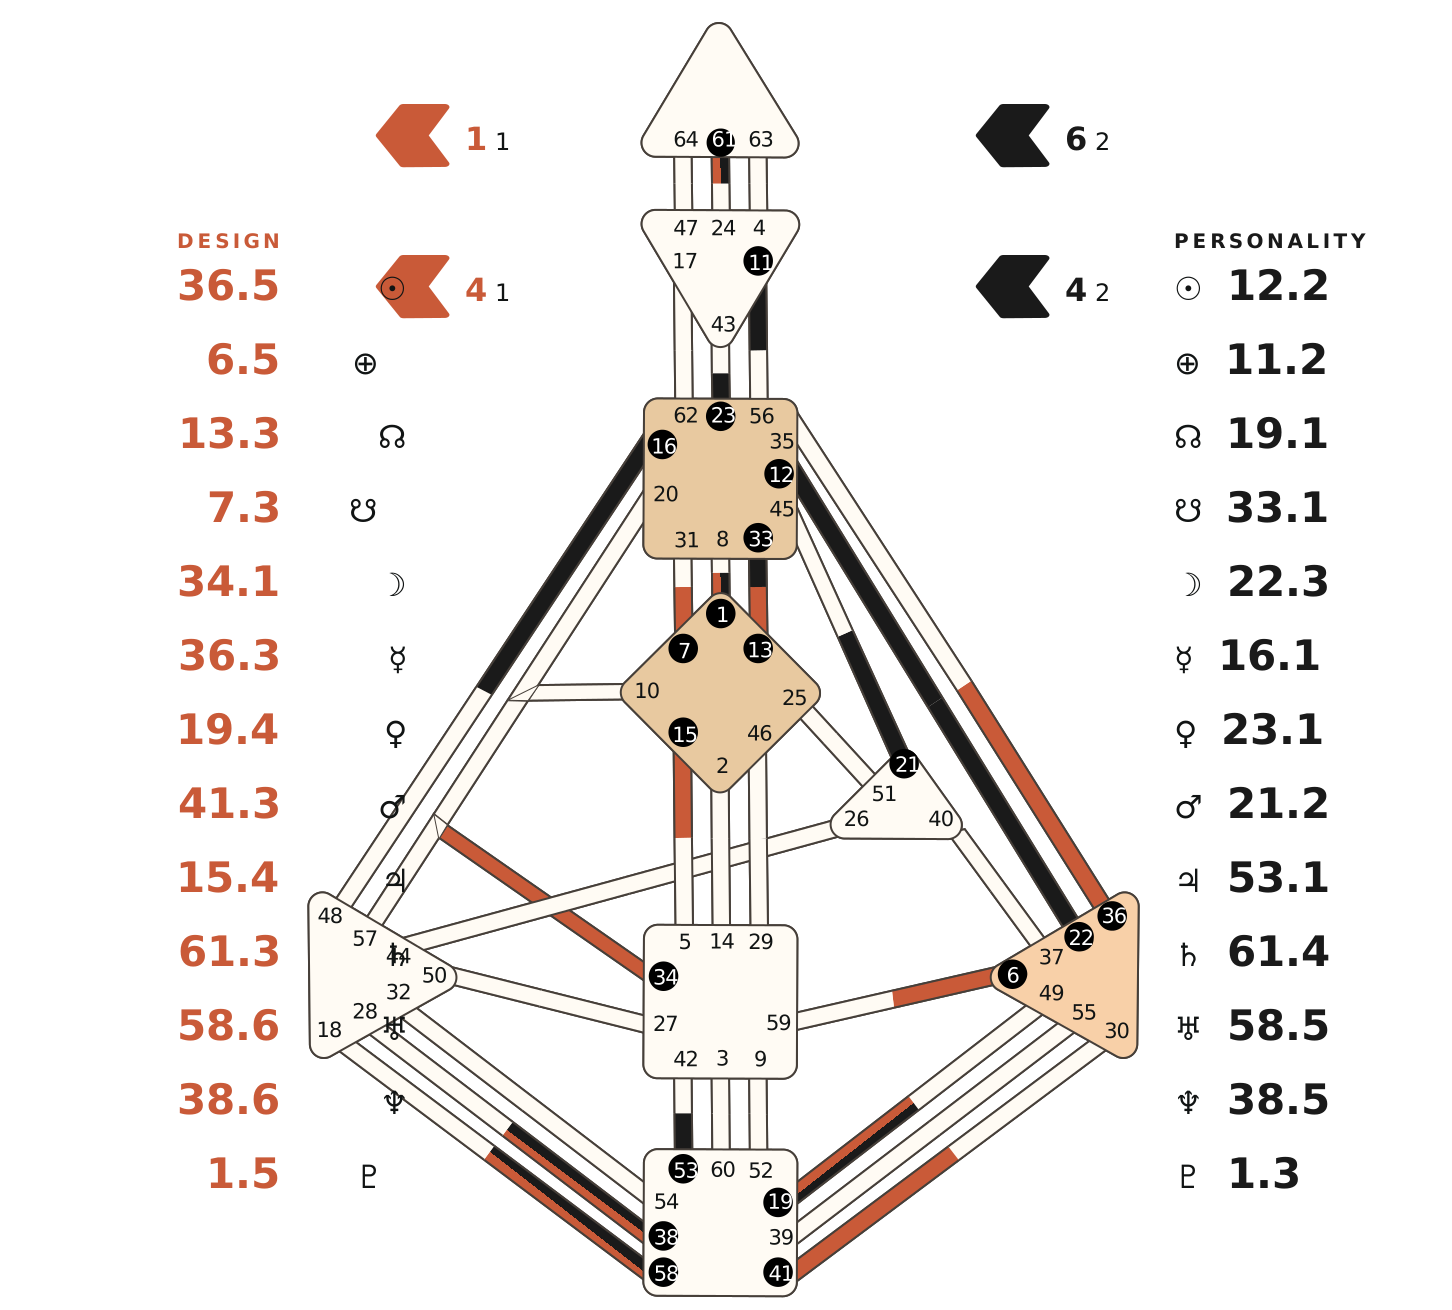
scale multiplies the exported image's pixel size (1× is 1452 × 1310 with columns); the drawing is identical at every size, and for PNGs an explicit width wins. The image frame never changes with the layout parameters — they move things inside it. columnGap sets how far the Design and Personality columns sit from the chart, columnOffsetY shifts them up or down, columnSpacing sets the distance between rows, columnScale sizes the markers and numbers, and columnRules toggles the hairlines under each row.
The four Variable arrows are drawn from the chart's real orientations with their color and tone numbers. variables hides them, arrowStyle picks the shape (chevron, triangle, outline, line), and varScale, varX, and varY size and move them. centerRadius (0–14) rounds the corners of the nine centers.
Response
The SVG is returned as image/svg+xml and the PNG as image/png. Both include a 24-hour cache header for CDN caching.
Every gate, center, and connector carries a stable id and data-* attributes. Inline the SVG to style it with CSS:
Attach mouseenter or click listeners to [data-gate] or [data-center] elements for interactivity.
Embed in the chart response
Add ?include=bodygraph to /api/chart to embed the SVG in the data.bodygraph field. Combine it with tooltips: ?include=tooltips,bodygraph. Every render parameter applies.
A render costs 1 Chart request. An embedded render adds 1 to the base call, so /api/chart?include=bodygraph costs 2. Request images from your backend and serve the bytes to users.